Fragmented data
Horse-related information is often stored across different tools, such as Excel, WhatsApp, fitness apps, and veterinary notes.

Project overview
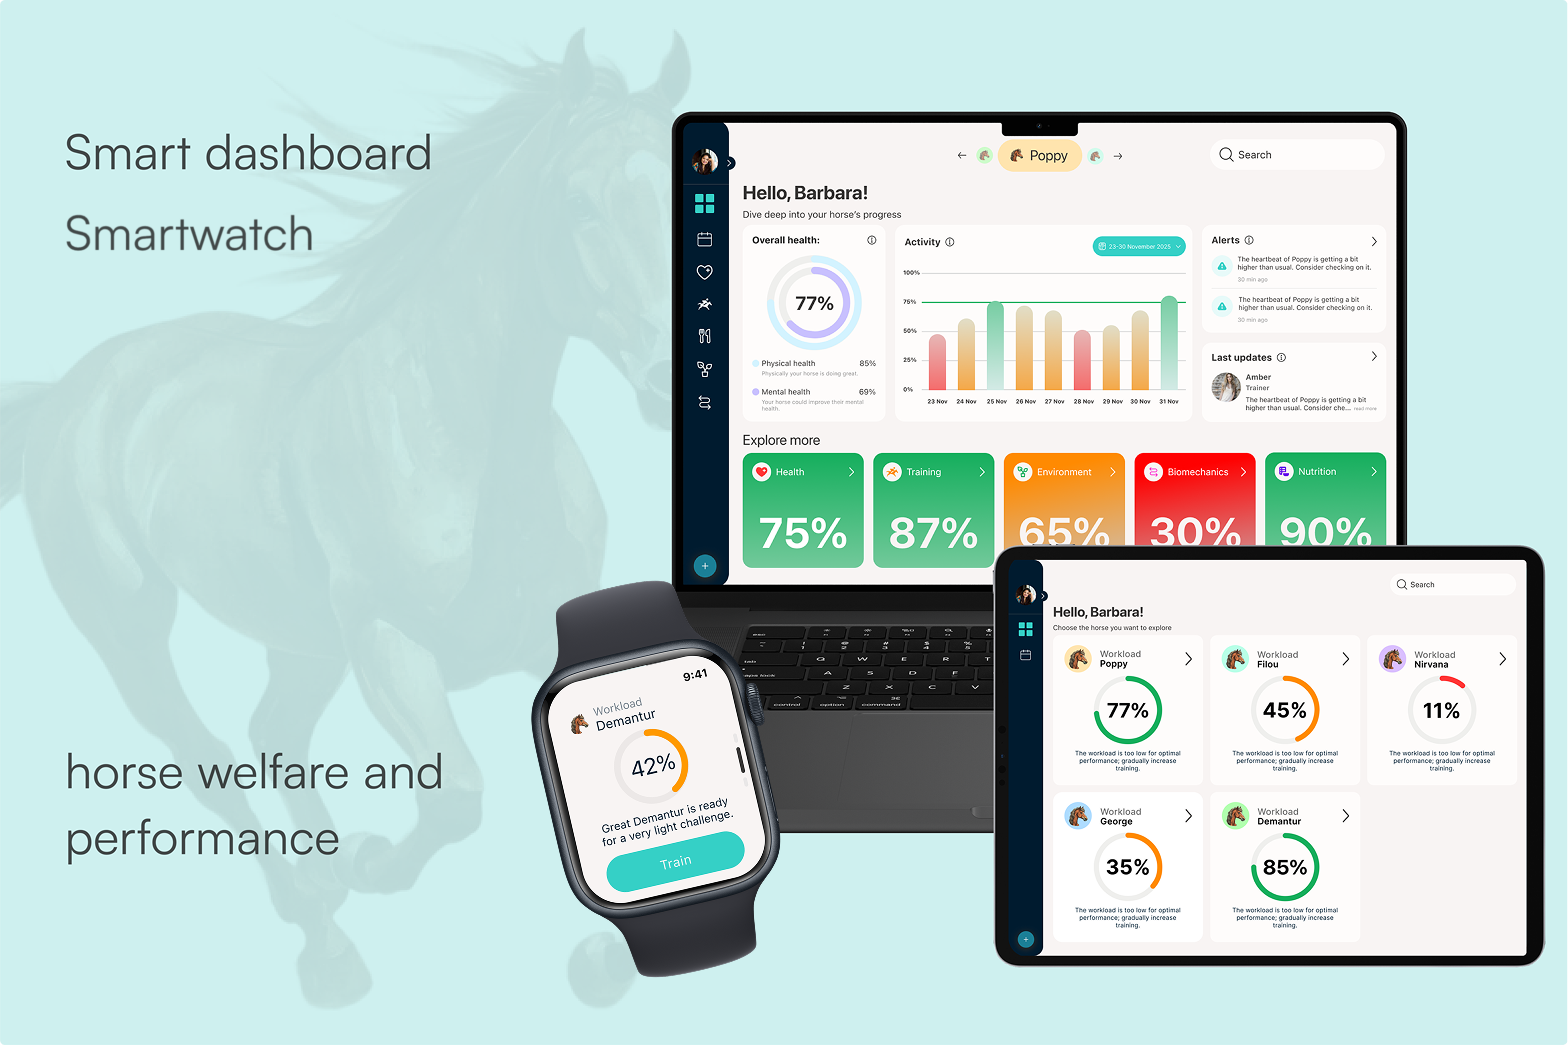
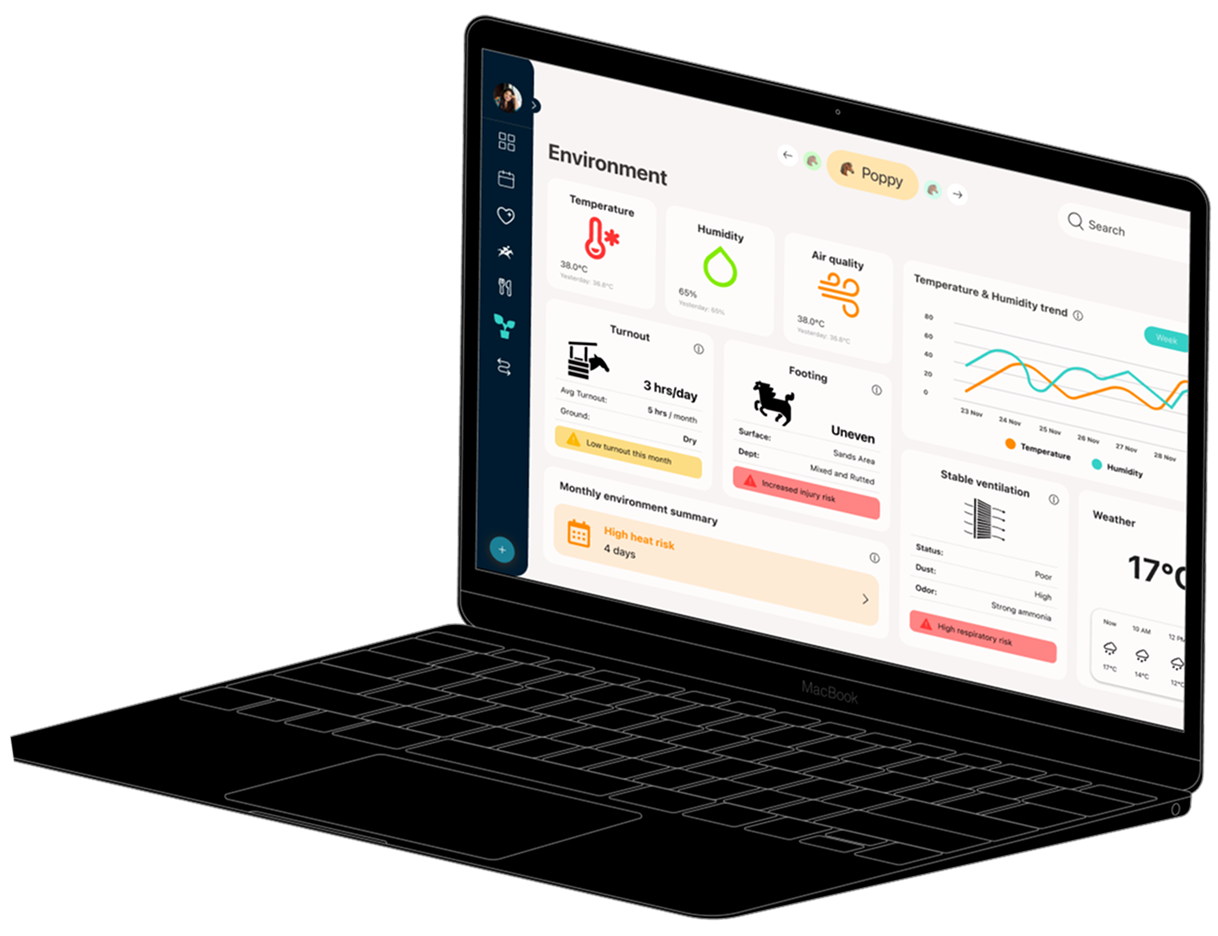
The dashboard brings scattered horse-related data into one clear digital overview. Instead of relying on separate tools such as Excel sheets, WhatsApp messages, fitness apps, and veterinary notes, users can view training, health, nutrition, environment, and performance information in one connected system.
The goal was to create a clear and professional interface that supports daily decision-making, improves collaboration, and helps users identify welfare risks earlier.
Research foundation
The design was based on stakeholder and user research, supported by desk research and UX methods such as affinity mapping, personas, and journey mapping. Research was conducted with different equine-related roles, including a project stakeholder, a trainer/veterinary professional, and a rider.
Horse-related information is often stored across different tools, such as Excel, WhatsApp, fitness apps, and veterinary notes.
Trainers, riders, veterinarians, and managers do not always have access to the same information at the same time.
Users need quick and understandable feedback to recognise risks, track welfare, and make daily decisions.
Dashboard structure
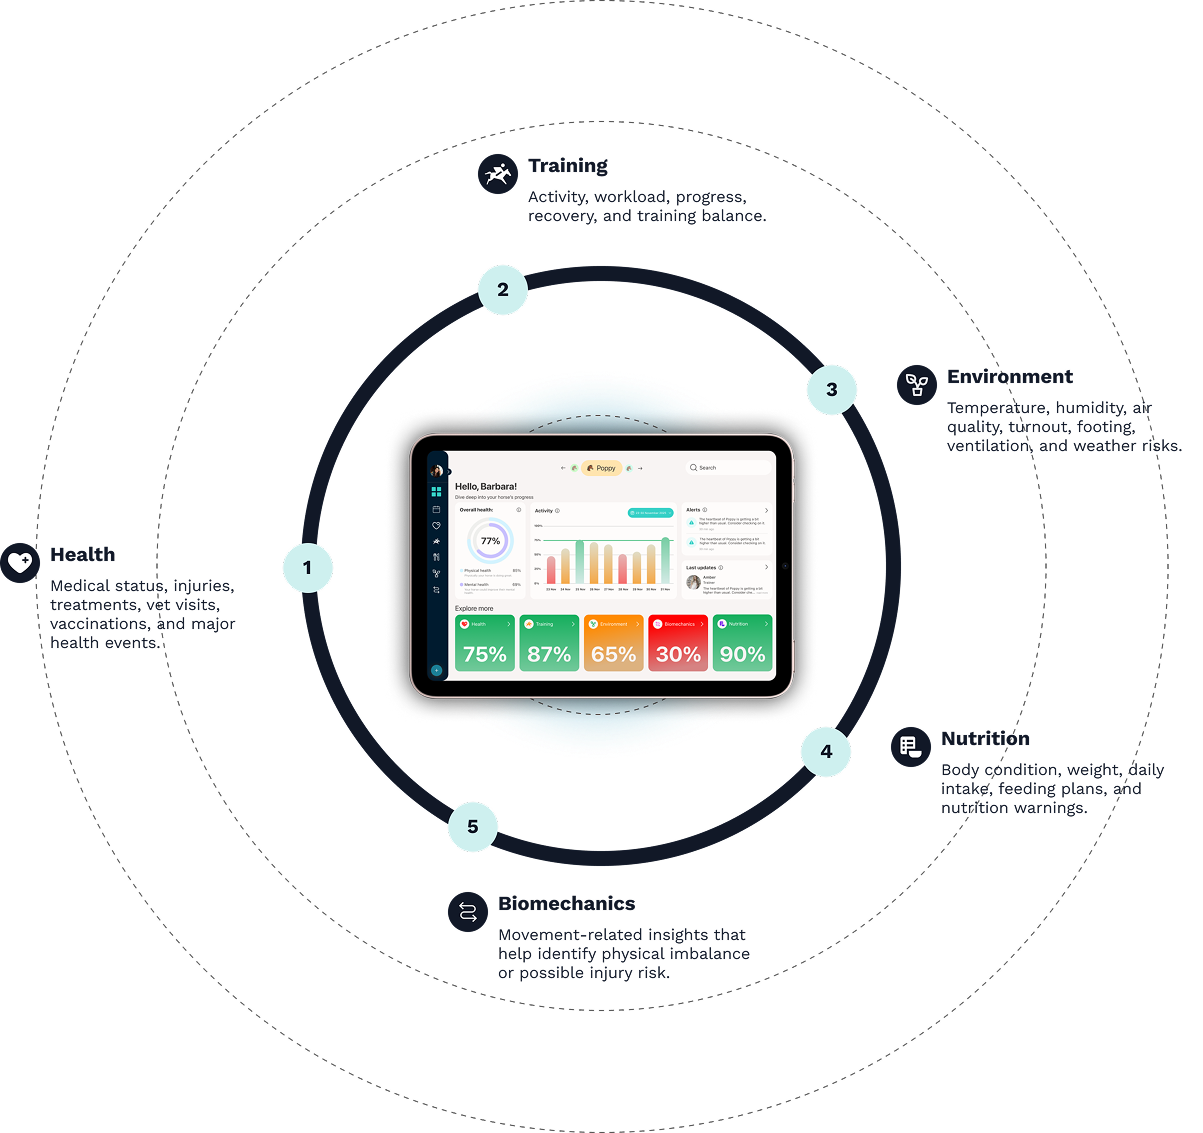
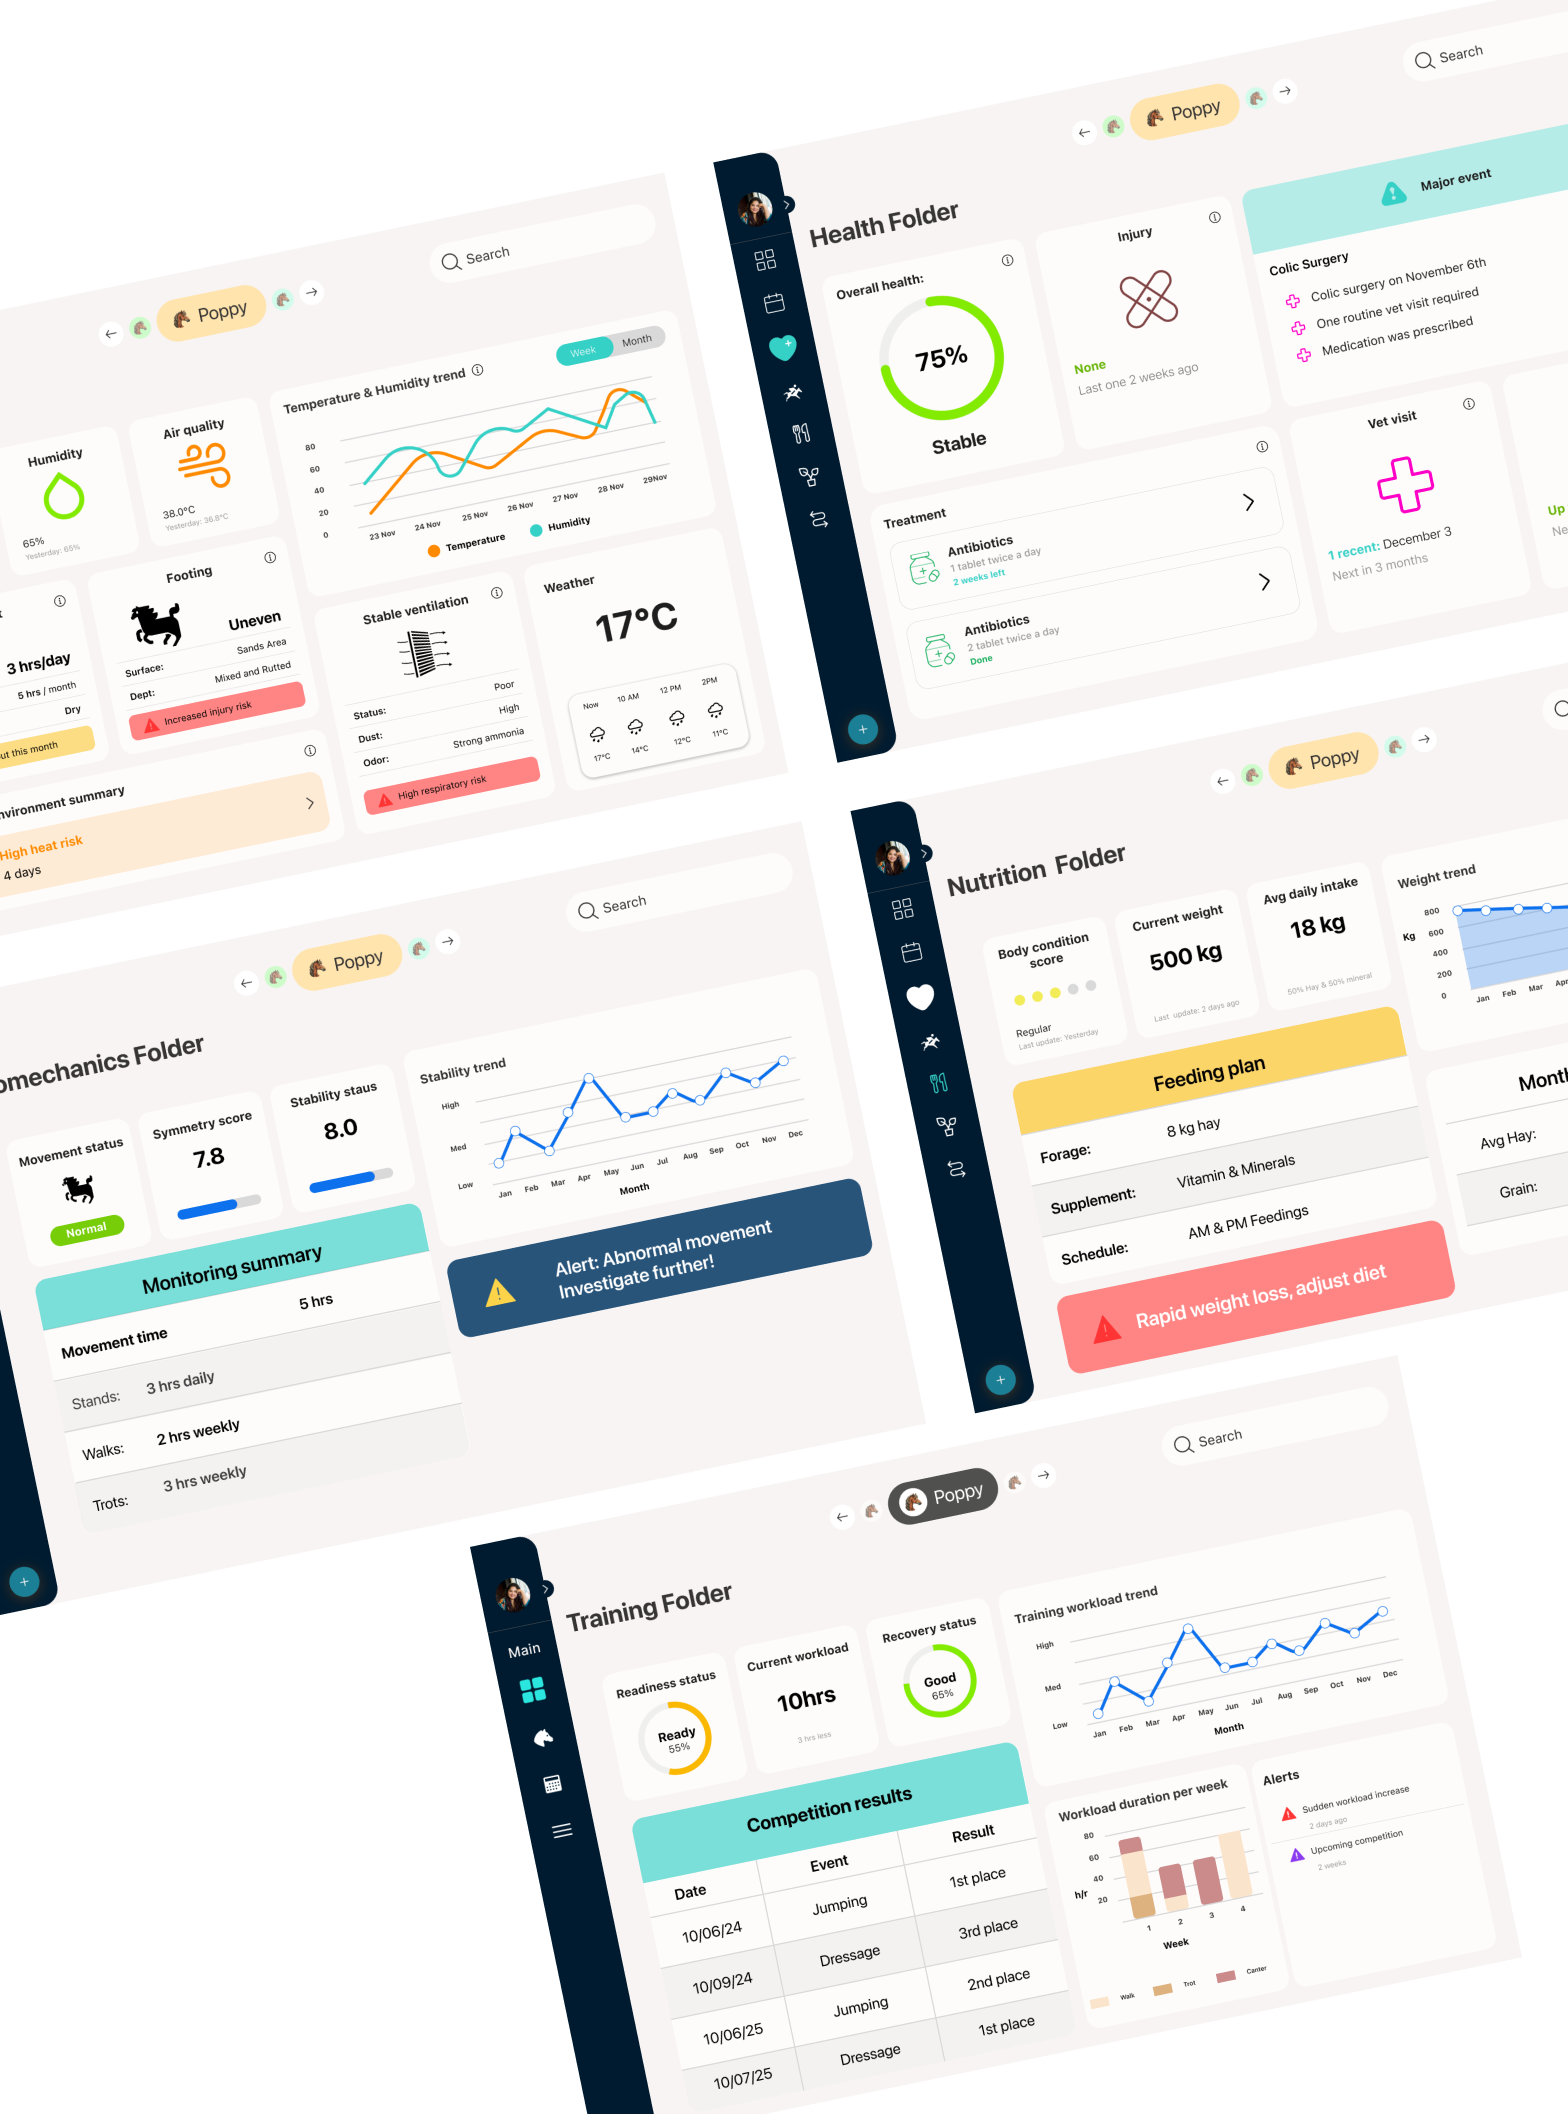
These areas help users quickly understand what is happening with the horse and where attention may be needed.
Home page
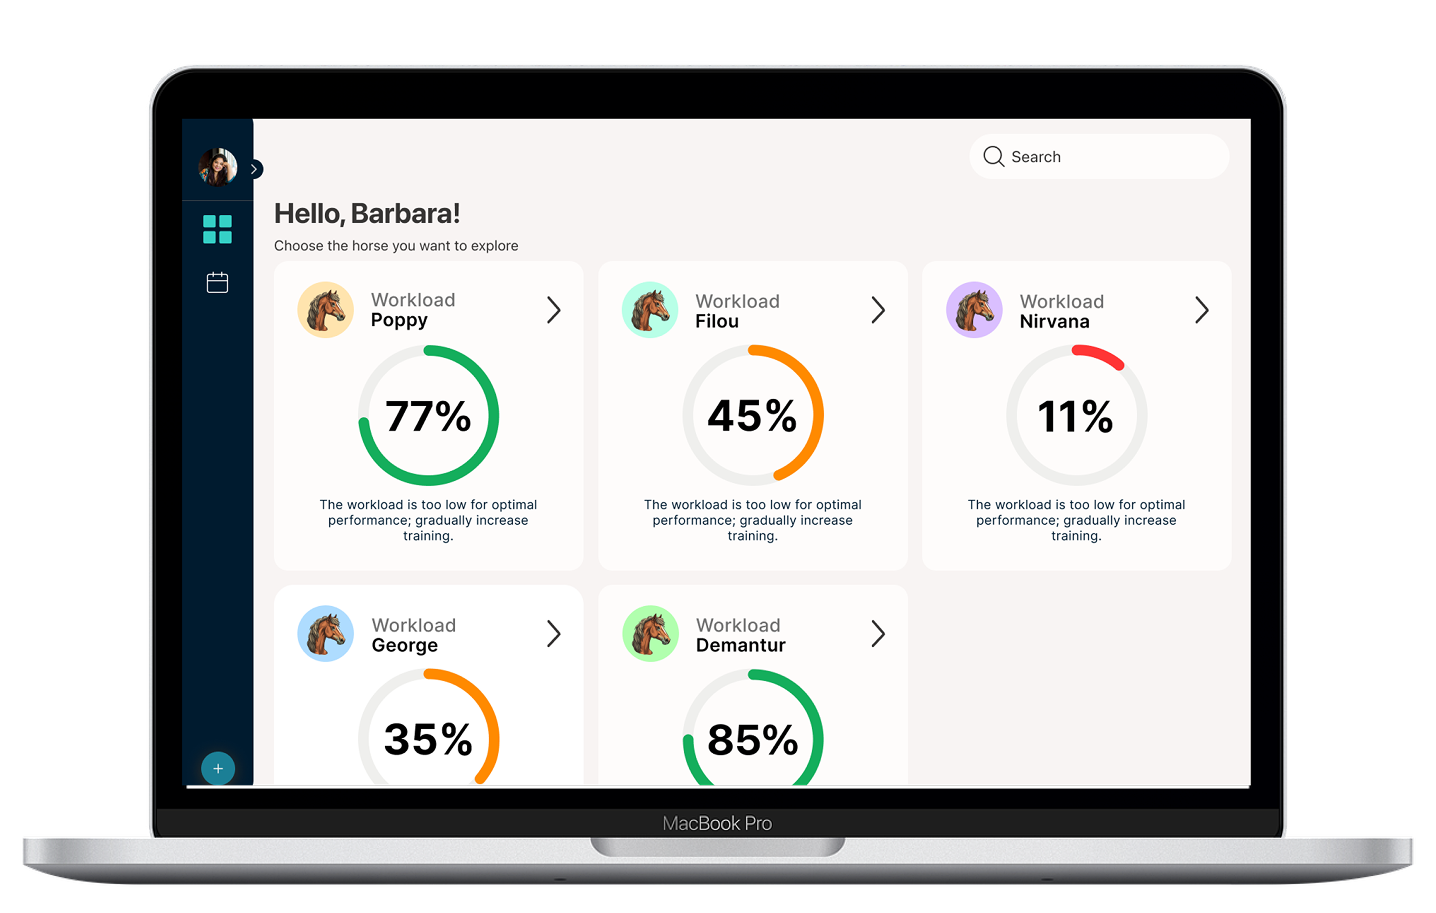
The main dashboard gives users a quick summary of a horse’s current condition.
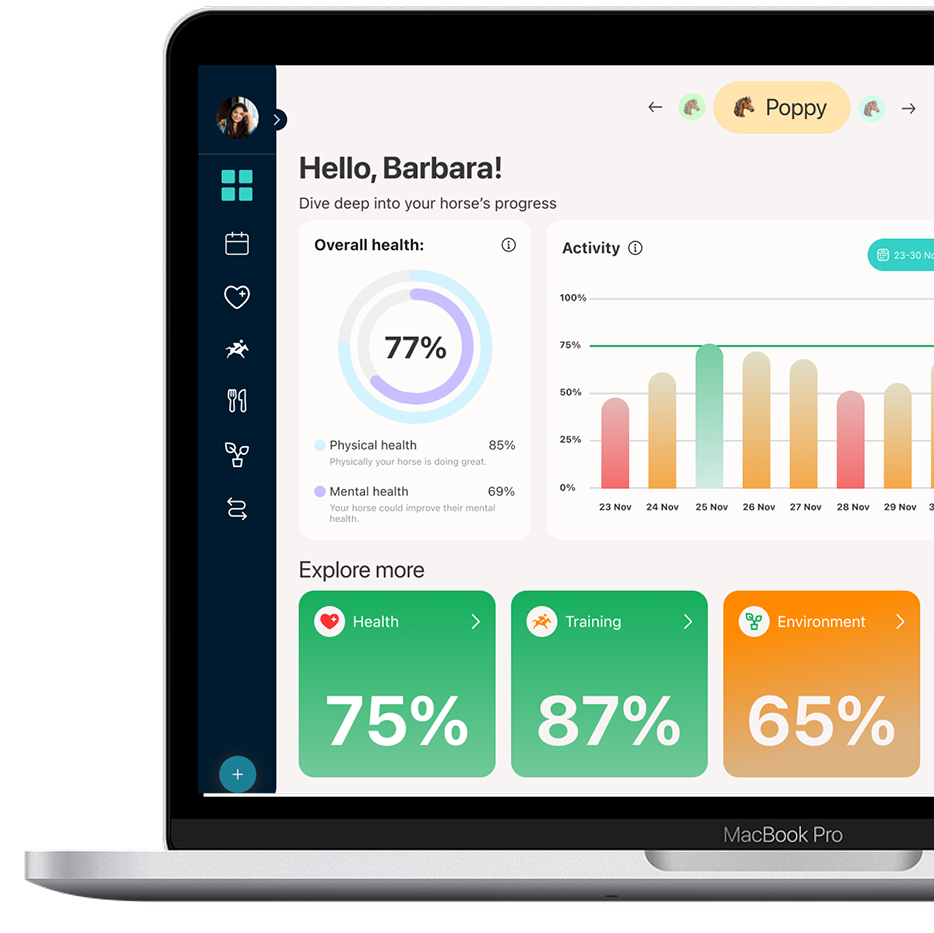
It includes the horse’s overall health, activity progress, alerts, recent updates, and direct access to the five welfare areas. This allows users to quickly see whether the horse is doing well, needs attention, or requires follow-up.
The interface uses color-coded cards to make the information easier to scan. Green shows a stable condition, yellow signals attention, and red highlights possible risk.
Dashboard page
Overview of the health of the horse’s physical and mental well-being.
This presents the daily activity score based on how much training a horse completed each day.
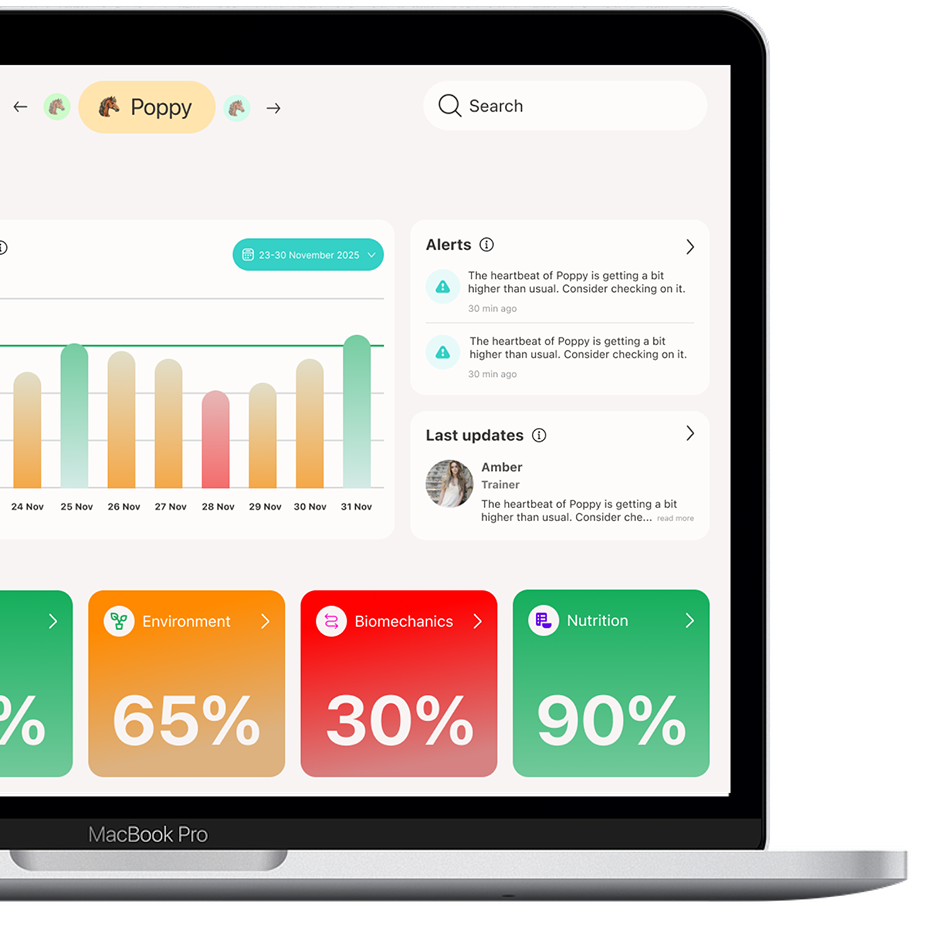
Alerts inform when something may require attention or adjustment.
Updates make communication clear between rider, trainer, and caregivers.
The main dashboard gives users a quick summary of a horse’s current condition.
The interface uses color-coded cards to make the information easier to scan. Green shows a stable condition, yellow signals attention, and red highlights possible risk.
Calendar & Planning
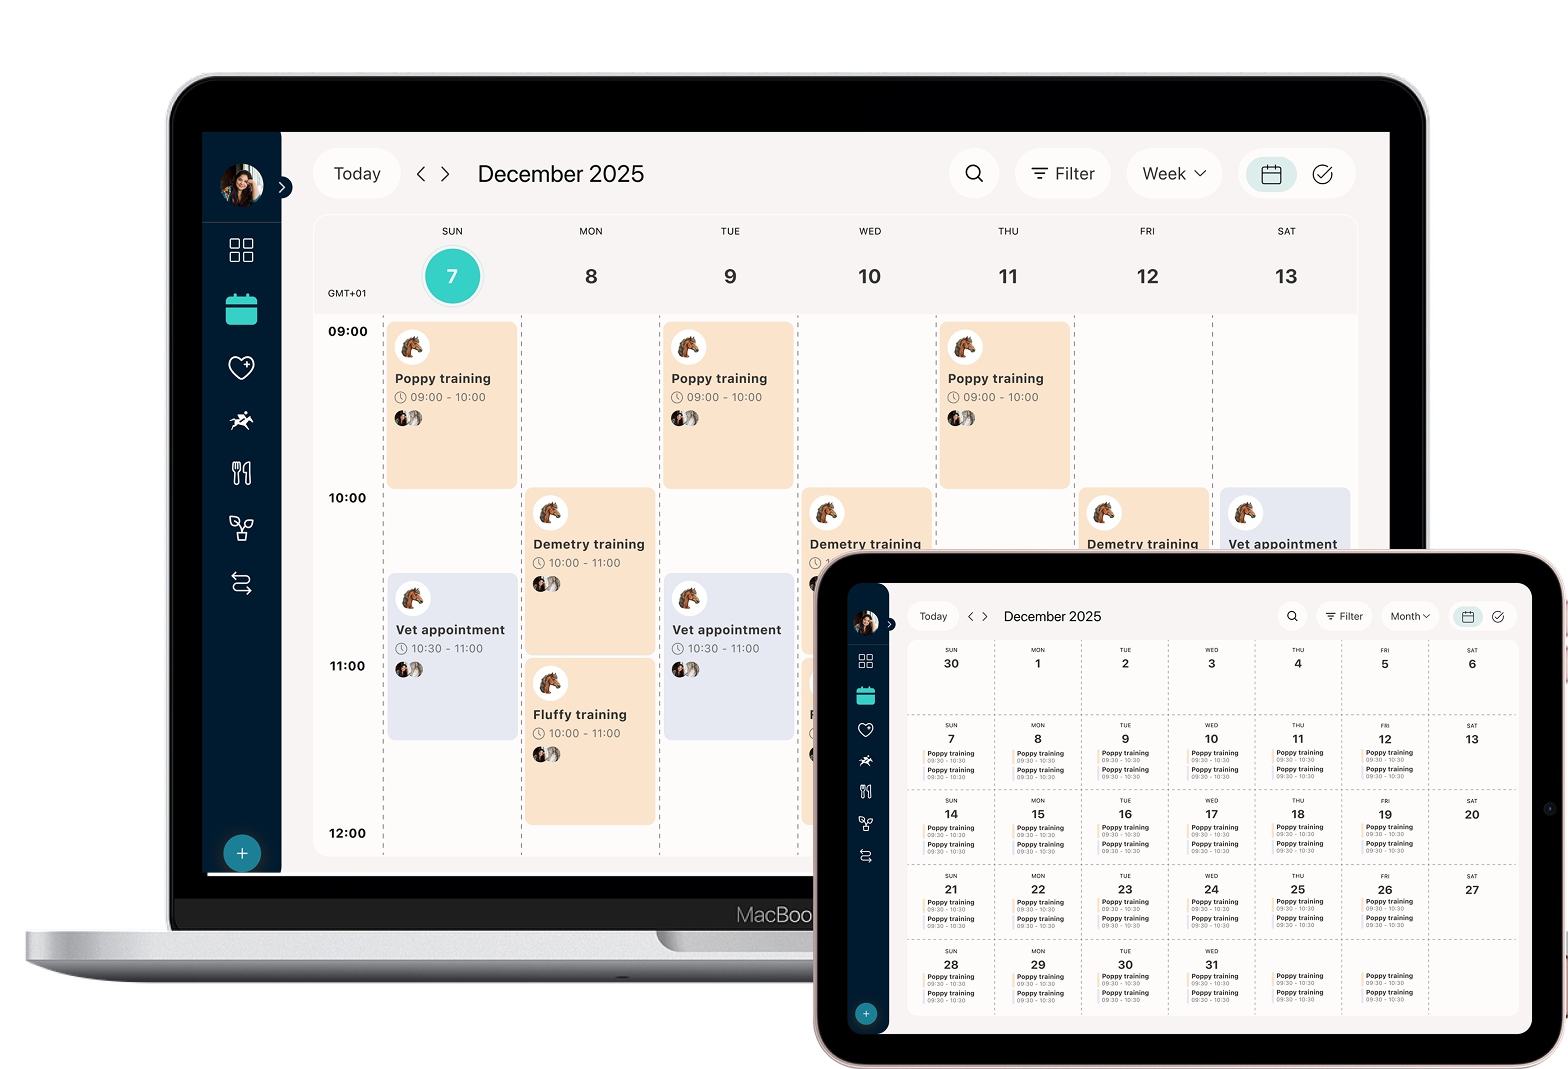
The calendar helps users plan and manage horse-related activities.
Users can view training sessions, vet appointments, feeding tasks, and other care activities in weekly or monthly views. Filters allow them to focus on specific event types, such as trainings, vet appointments, or meal plans.
This feature supports better coordination between trainers, riders, veterinarians, and care teams.
Live training feedback for riders
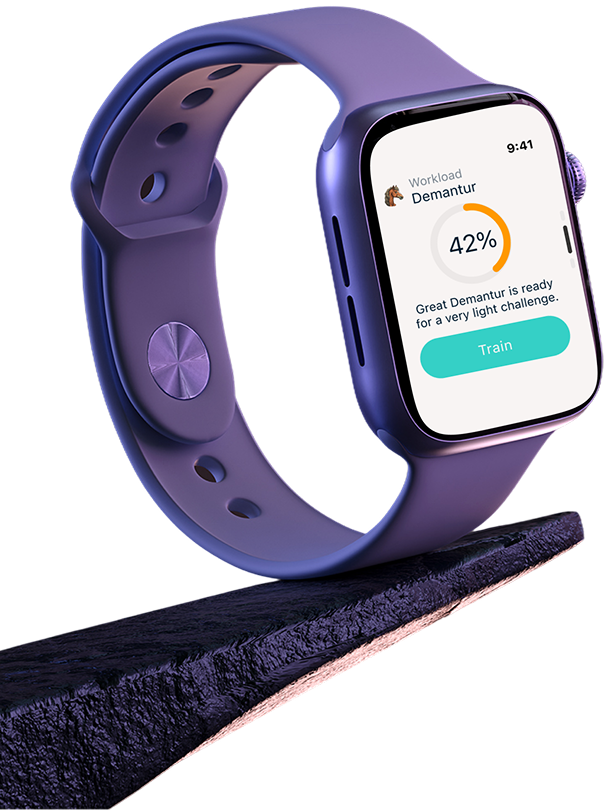
The concept helps riders monitor how the training session is affecting the horse in real time. Instead of waiting until after training to review the data, the rider can receive quick feedback directly on their wrist and react when needed.
Challenge
During training, riders need to stay focused on the horse, the environment, and their own performance. This means they cannot interact with complex screens or read detailed data while riding. The challenge was to design a smartwatch interface that gives riders important feedback quickly, without distracting them from the training session.
How can live horse data be shown to riders in a simple and actionable way during training?
Information should be readable within seconds.
The rider should not need to interact with long menus or complex screens.
The interface should tell the rider when something needs attention.
The rider should be able to follow the session progress and review a short summary afterward.
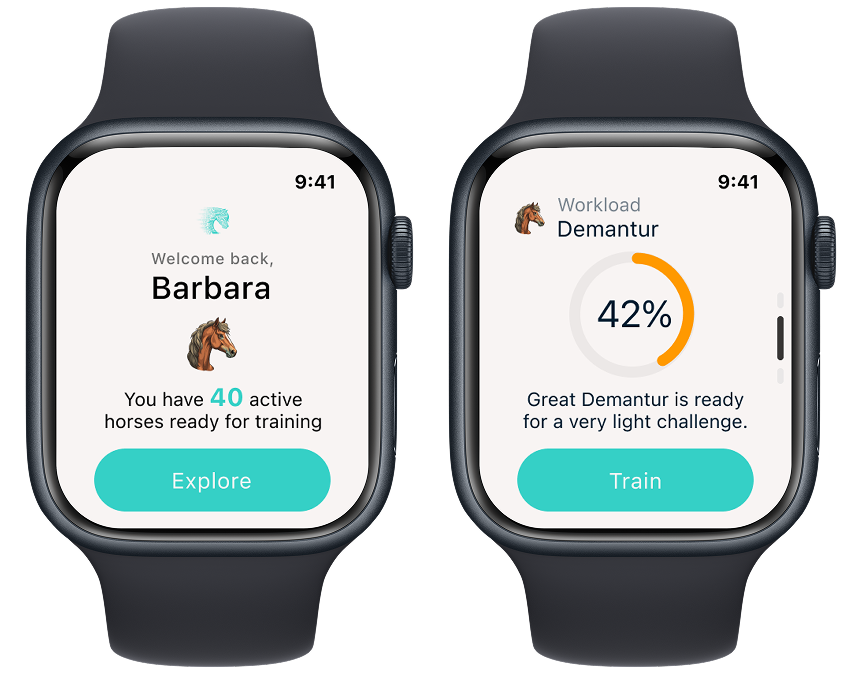
Workload check
Before training, the rider can check whether the horse is ready for the session. The workload screen shows how prepared the horse is based on previous activity and condition. This helps the rider decide whether to continue with the planned training or adjust the intensity.
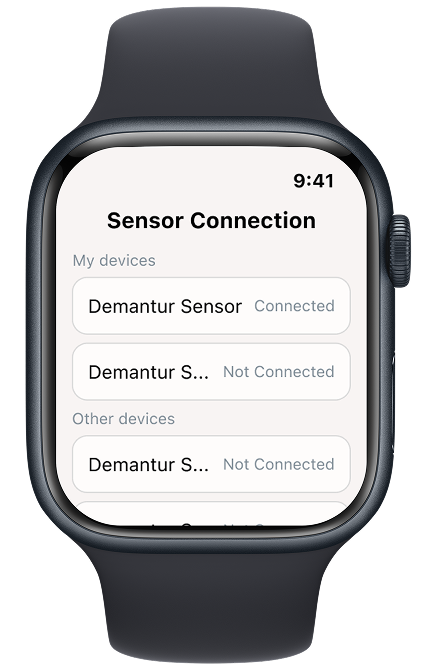
Sensor Connection
The sensor connection screen helps the rider check whether the horse’s sensor is connected before training starts. This makes the data more reliable and prevents the rider from starting a session without active tracking.
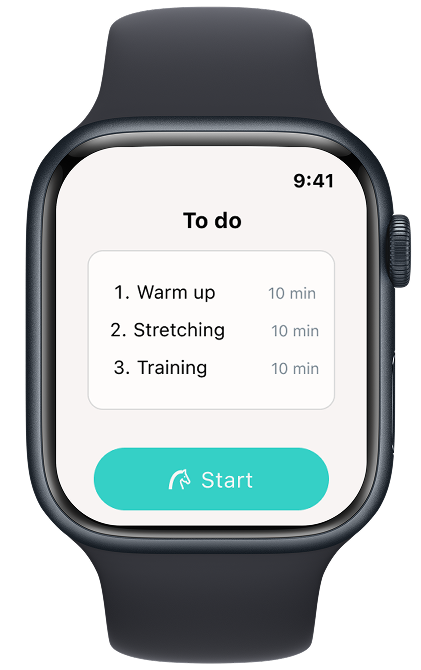
Training To-Do
The training to-do screen gives the rider a simple step-by-step overview of the planned session. It keeps the training structure clear, so the rider can follow the warm-up, stretching, and training phases without checking a phone.
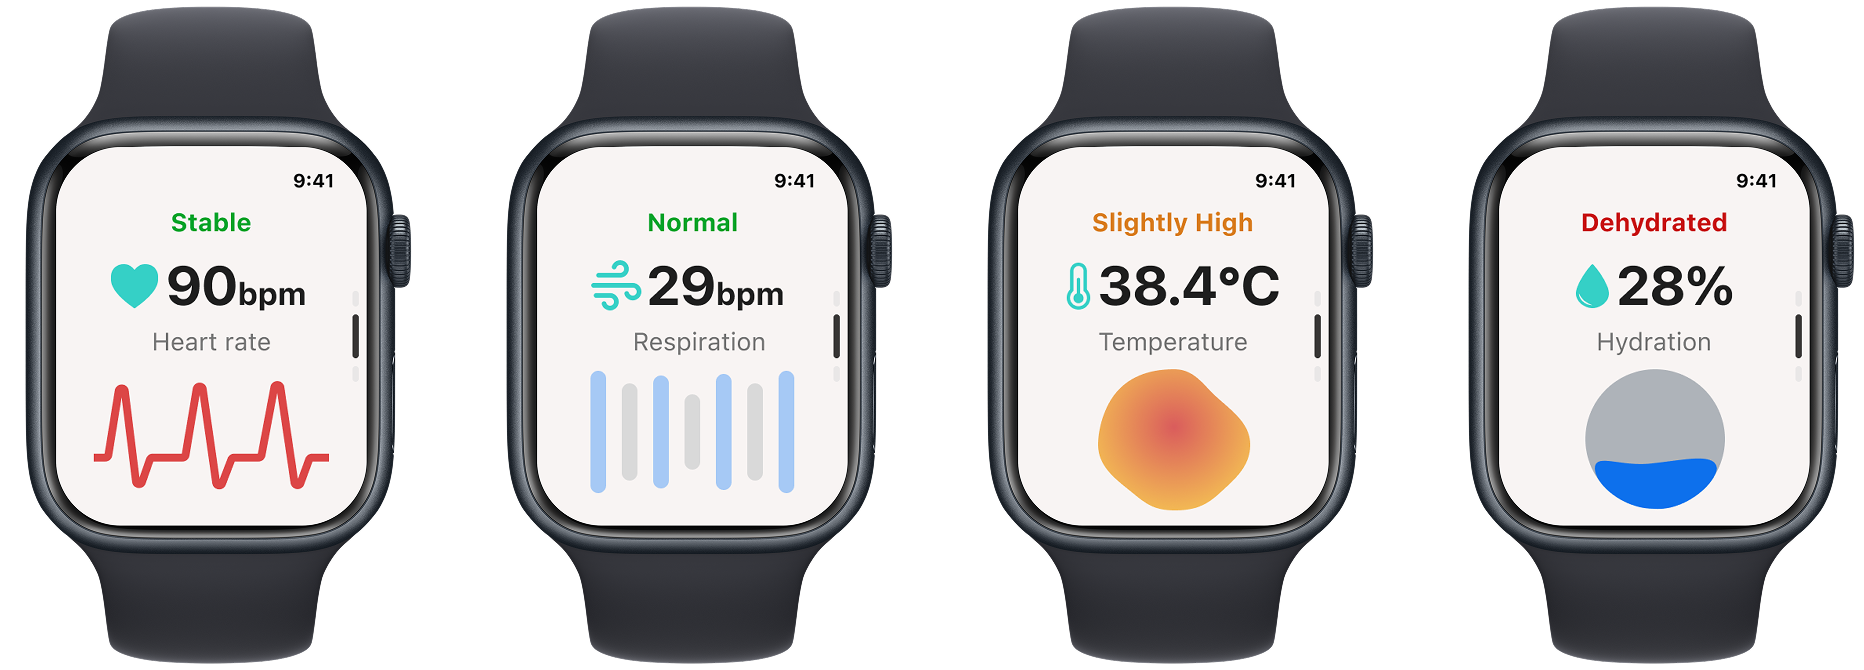
Live Health Feedback
During training, the watch shows live health signals such as heart rate, respiration, temperature, and hydration. This helps the rider notice changes quickly and understand when the horse may need rest or attention.
Activity Tracking
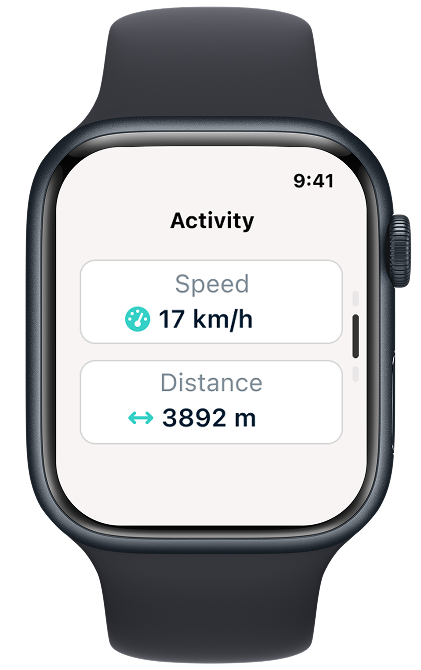
The activity tracking screen shows basic training data such as speed and distance. This helps the rider follow the overall session progress without needing to use a phone or separate fitness app.
Alerts
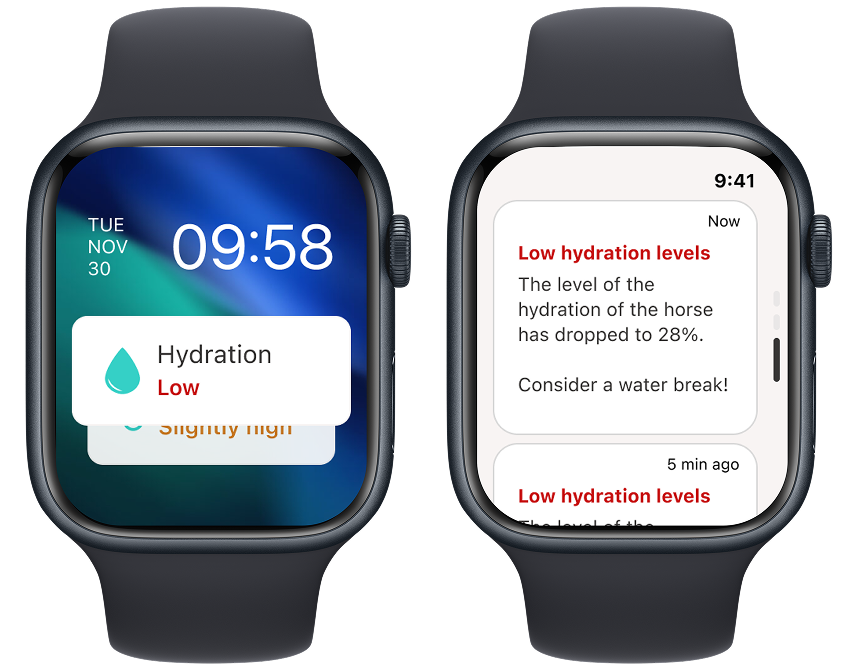
Alerts notify the rider when something may need attention during or after training. For example, the watch can highlight low hydration, unusual heart rate, or other changes that may affect the horse’s welfare.
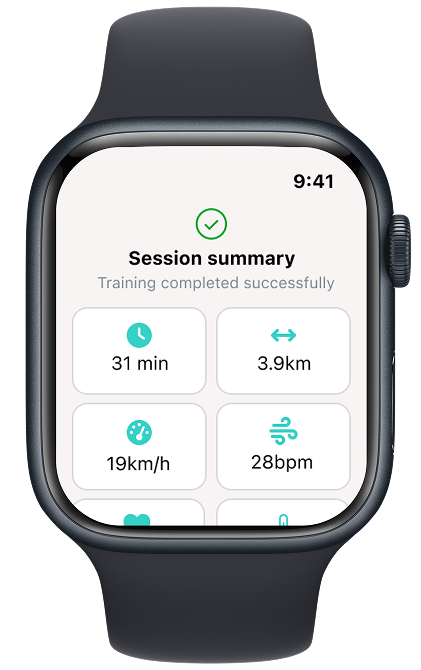
Session Summary
After training, the session summary gives the rider a quick overview of the completed session. It shows key results such as duration, distance, speed, and health feedback, so the rider can review the session in a simple way.